City of Anaheim Fellowship Challenge:
Addressing Parking Shortages in Vulnerable Neighborhoods
The City of Anaheim faces significant challenges with affordable housing shortages and automobile dependence, leading to overcrowding and severe parking shortages in vulnerable neighborhoods. These issues burden residents with parking citations, create safety concerns, and diminish quality of life. In response, the Mayor and City Council have prioritized community-driven solutions beyond increasing parking, aiming to improve public safety, transportation, and access for these vulnerable neighborhoods.
Solving Anaheim’s parking challenges required a broader analysis of its mobility systems. Through the ten-week Fellowship, we took a proactive approach, examining infrastructure, transit accessibility, and travel patterns using multiple datasets to identify strategic intervention opportunities. This data-driven strategy led to the Street Connectivity Matrix, a proof-of-concept tool that provides mobility data analytics to support decision-making and prioritize future investments.

Community feuds: Residents saving parking spaces for family members and friends. Photo was taken at one of Anaheim’s vulnerable neighborhoods.

Map of Anaheim highlighting the City’s most vulnerable neighborhoods. These neighborhoods experience many quality of life challenges.
Anaheim’s Urban Grid
American suburbs, including Anaheim, are heavily influenced by car-centric planning, resulting in exceptionally large urban blocks and streets. To provide context, we adapted a diagram from Joan Busquets’ Urban Grids to show the scale of an Anaheim block in relation to others worldwide. The comparison underscores that Anaheim features some of the largest urban blocks globally, highlighting the need for a reimagined approach to urban design that prioritizes walkability and connectivity.

The diagram was adapted to include the City of Anaheim. Source: Urban Grids: Handbook for Regular City Design by Joan Busquets
Anaheim’s Oversized Maxiblocks and Megablocks
Most walkable urban blocks around the world are around 300-600 feet. Cerda’s design for Barcelona and Haussman’s layout for Paris are famous for their walkability and charm. In the U.S., cities like New York, San Francisco, and Portland also have neighborhoods that provide great pedestrian experiences.
However, newer cities designed around the automobile elongated the blocks and widened the streets, prioritizing vehicular speed over pedestrian safety and comfort. Navigating these elongated blocks makes walking tedious, and crossing wider intersections increases the risk of accidents. These larger urban forms are referred to as Maxiblocks and Megablocks.
Maxiblocks are larger than traditional urban blocks. They incorporate internal circulation systems, such as alleys or secondary access streets, but often lack aligned subdivisions to adjacent blocks, reducing permeability and connectivity. Their dimensions typically range from 600 to 1,200 feet per side, responding to varying planning approaches and geographical contexts.
Megablocks are more extensive in scale, often resulting from consolidated land parcels within Maxiblocks. Depending on the city's planning framework, megablocks can span several thousand feet to over half a mile. Transversing a Megablock on foot is a demanding and exhausting experience, taking about 20 minutes to walk from corner to corner.
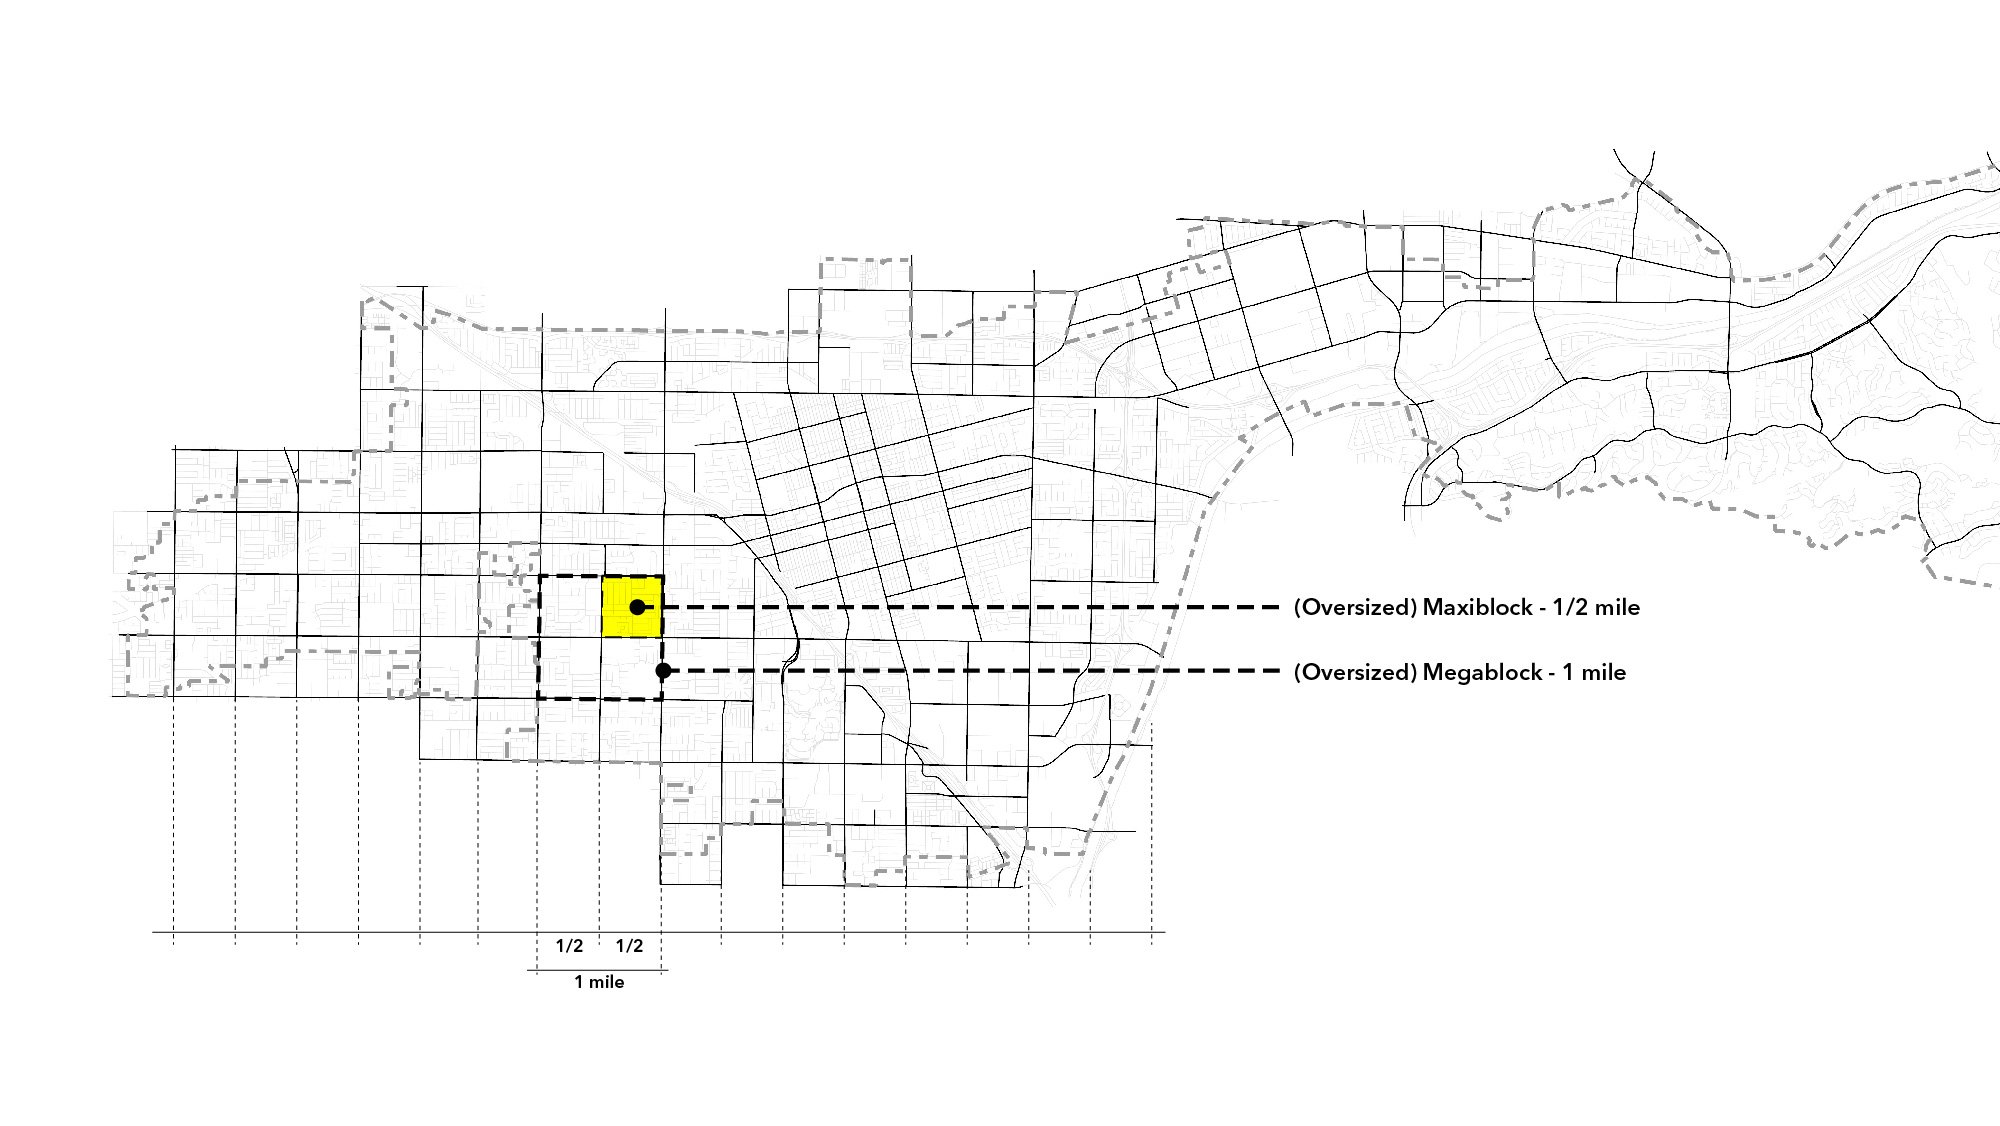
Map of west Anaheim showing the city’s oversized maxiblocks (1/2-mile) and megablocks (1-mile) within their transportation network.
Anaheim’s Maxiblock Aerial Diagram Comparison
This aerial diagram compares the size of Anaheim’s and Abu Dhabi’s oversized maxi blocks to the more pedestrian-friendly blocks in Santa Barbara, Guadalajara, and Houston—familiar references to Anaheim residents. In the Anaheim maxiblock, faint internal subdivisions attempt to break the block into quadrants through parcelization, yet they are devoid of internal connecting streets to adjacent maxiblocks. Without internal local roads to complement the half-mile grid, the network of avenues around maxiblocks become physical barriers, where pedestrian crossings are often relegated to the corner intersections. As a result, these barriers reduce walkability and pedestrian safety and isolate communities within each maxiblock.

Twenty-five (25) Santa Barbara Blocks Fit into One (1) Anaheim Maxiblock
Santa Barbara, a popular city in Southern California, is known for its quaint character and walkability. To illustrate the vast scale of an Anaheim maxiblock, this diagram juxtaposes the size of the familiar Santa Barbara block over the Anaheim maxiblock. Astoundingly, 25 Santa Barbara blocks fit within a single Anaheim maxiblock, highlighting the stark contrast in urban form and the suppressed connectivity in the Anaheim half-mile maxiblock.

One-mile Bus Network = Suburban Car Dependency
The Orange County Transportation Authority (OCTA) bus network primarily runs along the perimeter of the one-mile Anaheim megablocks. In the diagram below, the yellow circles represent bus stops—with larger circles indicating higher daily ridership. Notably, the busiest stops are concentrated at the corners of the one-mile megablocks. Since a single Anaheim maxiblock—which can fit 25 Santa Barbara blocks—is just one quadrant of a larger one-mile megablock, walking to the nearest bus stop can take 20 minutes or more, depending on the starting point.
Another defining aspect of car dependency is low transit frequency. OCTA’s bus system operates with headways (the time interval between buses) ranging from 22 to 60 minutes. Frequent, reliable service is essential for transit success, influencing ridership, accessibility, and urban mobility. Cities prioritizing high-frequency transit see higher ridership, reduced congestion, and an improved quality of life.
Anaheim’s long bus wait times, combined with walks of 20 minutes or more just to reach a stop, make the system so inconvenient that it entirely discourages public transit use. As shown here, a car-centric urban grid gives shape to oversized maxiblocks and megablocks, inherently making transit inaccessible. This lack of accessibility lowers demand, allowing agencies like OCTA to justify increasing headways under the pretext of low ridership. This self-perpetuating cycle has been a major driver of inescapable car dependency.


Vehicle Travel Patterns
Using location-based services (LBS+) data from the Southern California Association of Governments (SCAG), this study analyzed origin-destination patterns to assess mobility trends in Anaheim. The data provided insights into traffic demand, commute behavior, connectivity gaps, and opportunities for public-private partnerships to improve mobility systems.
Citywide Origin-Destination Trips
Using the Anaheim City boundary as the origin-destination (shown in pink), this analysis examined trending destinations (shown in blue) for all trip types and vehicle categories occurring Monday through Sunday during peak morning hours (6 AM to 10 AM). While this dataset included all trip types, potentially mixing visitor and tourist trips, filtering for morning peak hours provided a provable indicator for work-related travel trends in Anaheim. The results show that 7.25% of all trips ended in the Resort District, home to Disneyland, Anaheim’s largest employer. The second-highest concentration was in the Canyon District, a former industrial zone evolving into a significant employment hub with emerging businesses and amenities, including Kaiser Permanente, the city’s second-largest employer.

Vulnerable Neighborhoods Work-trips Analysis
With a more manageable dataset, this query focused specifically on work-related trips. The mobile data platform assigned "home" locations to devices that remained at the same place for more than 30 nights and "work" locations to those that stayed at the same daytime location for over 30 days. Using this filtering method, the analysis examined work trips originating from vulnerable neighborhoods in Anaheim, shown in pink, to identify commute patterns. The work destination results (shown in blue) confirmed that over 46% of all work trips ended in the Resort District, primarily at Disneyland, reinforcing its role as the city’s largest employment hub. Identifying high-traffic work destinations can guide targeted transit improvements and first-mile/last-mile solutions to reduce car dependency and improve connectivity for Anaheim’s workforce.

Strategic Data Sets for the Street Connectivity Matrix
Bus Stop Score
With data provided by the Orange County Transportation Authority (OCTA) we filtered the successful suburban stops with at least 40 daily boardings as a vital component of the Street Connectivity Matrix. By identifying and focusing on these high-ridership stops, we can build on existing successes and create further momentum for public transportation improvements. These stops are essential metrics for promoting future transit-oriented development, advocating for higher frequency schedules, and enhancing overall transit quality.
Although citywide ridership may be modest, the Bus Stop Street Rank identifies areas with significant daily boardings. Encouraging commercial and higher-density residential uses around these high-performing stops can further integrate the transportation network into the regional economy, broadening the community benefits of these initiatives.

Bike Commute Score:
The Strava Metro program works with public organizations to provide active mobility data from their platform. This collection of user-based data can strategically enhance the city’s bicycle infrastructure by highlighting streets with significant bicycle commuting activity. The Bike Commute Street Rank shows areas with high volumes of work-related bike travel, many lacking dedicated bike lanes. By prioritizing these streets for infrastructure improvements, we can better connect workforce hubs, promote health and wellness, and advance mobility equity.
Recognizing that current infrastructure often doesn't align with actual cycling patterns, this strategy allows us to tailor the city’s future design to meet residents' needs. By enhancing bike lanes on high-ridership streets, particularly those without existing facilities, we can organically expand the bike network, creating a safer, more connected, and cyclist-friendly Anaheim.

Park Proximity:
This dataset allows us to measure the distance between each street segment and the nearest parks or green spaces, offering valuable insights into how easily residents can access these essential amenities on foot. Safe and convenient access to open spaces through pedestrian and cycling routes enhances physical and mental health, fosters community building, and contributes to increased street safety.
In addition to identifying areas where access to parks may be lacking, this dataset is also instrumental in guiding future development. By focusing on enhancing proximity to green spaces, urban planning efforts can further promote the sustainability of these areas and optimize the use of existing urban amenities. This approach promotes healthier, more connected, and sustainable communities.

Car-Free Shopping Score (Propensity for Micromobility)
Due to the number of abandoned grocery shopping carts, the City contracted a third-party company to retrieve them. The Car-Free Shopping Score dataset leverages abandoned grocery cart data obtained from this contractor as a proxy to identify areas with a higher propensity for alternative modes of transportation. By analyzing the locations where grocery carts are frequently abandoned, this dataset provides insights into neighborhoods where residents are more likely to shop without relying on automobiles, whether by walking, cycling, or using public transportation.
This analysis identifies areas that may already support (or have a higher propensity for) car-free lifestyles, offering opportunities to enhance and expand infrastructure that supports alternative transportation. By understanding these patterns, we can target investments in pedestrian-friendly pathways, bike lanes, and new transit options, leveraging a data-driven approach to meet a critical need. Public and private partnerships could promote practical and impactful solutions to meet this particular need and plant the seeds for expandable programs in the City.

Parking Citations Recurrence Score:
The analysis of code enforcement and police-issued parking citations provides a crucial data layer for identifying areas with the most urgent need for alternative transportation modes. These areas are often characterized by high-density residential conditions and overcrowding, where parking demand significantly exceeds supply. This imbalance imposes additional burdens on local residents, neighboring communities, and enforcement agencies. A high concentration of citations in these areas elevates their priority for proactive transportation planning, signaling a greater need for implementing alternative transportation solutions.

Street Connectivity Matrix
Need + Opportunity = Priority
The Anaheim Street Connectivity Matrix is a proof-of-concept mapping metric designed to proactively address urban mobility challenges in the city's most vulnerable neighborhoods. This data-driven tool enables objective prioritization and strategic planning. As outlined earlier, the sample data enhances effective mobility systems while identifying areas with the most critical mobility gaps.
The Street Ranking graphs highlight the streets with the highest need for intervention and adaptability in each category. The combined matrix is based on the following data parameters:
Bus Stop Score: measures proximity to bus stops with high ridership.
Bike Commute Score: evaluates proximity to streets with high bicycle ridership for commuting.
Park Proximity Score: assesses distance to the nearest public park.
Car-free Shopping Score (Propensity for Micromobility): analyzes abandoned grocery cart data as a proxy to identify areas with a higher propensity to alternative modes of transportation.
Parking Citations Recurrence: identifies areas with elevated citation activity where residents most acutely feel enforcement impacts.
The streets with the highest scores (dark blue) highlight areas identified as top priorities for intervention.
Below are screenshots taken from the Street Connectivity Matrix, the web tool created during the ten-week Fellowship:


